
An Investors' Guide to the Indian Car Market
Nothing is permanent and we have seen the heyday of the hatchbacks and the sedans. But a close look at the momentum of growth being displayed will give an exceptionally good understanding of where different segments are going well in advance of their rise or demise.
 07 Feb 2025
 3992 Views
Share -
3992 Views
Share -


Where exactly should prospective investors in the third largest car market in the world be investing in? To be more specific, which segments of the markets are the ones to go in for and the ones to avoid at all costs?
The need to segment and sub segment
Looking at numbers at a gross level with metrics such as averages where we hear of how the Indian car markets have grown at “a measly” 4%, is only surface level analysis. It’s OK for headline news but does not help in any way in making impactful analysis from which insights that the industry is looking for are available.
To analyze below skin depth, it’s very essential that we segment the market based on either statistical tools or based on an incredibly good market understanding. In the in the Indian car markets, the latter holds good.
This article is also available as a PDF
The initial understanding where we broke the market into SUVs, MUVs, Sedans and Hatchbacks is one level of understanding. Where the understanding truly makes a difference is when you break up these segments into further sub segments where you look at these segments from a viewpoint of pricing and positioning clusters.
For example, the SUV market could be broken up into midsize SUVs, which is exemplified by the Hyundai Creta where the size of the car is just above 4 m in the region of 4.2 to 4.4 m. The other sub segment that we can look into is the popular 4 m SUV where the tax rates applied are quite different. They are shorter than those cars which are longer than 4 m and this shifts and shapes market demand. A car that is taxed at 28% GST + 1% CESS when it is 4 meters of lower in length, and comes with either a petrol engine below 1200 CC or a diesel engine below 1500 cc, is priced very differently when the car with the same engines and features, crosses the 4 meter barrier where the taxes vary slightly but are in the ball park of 28% GST + 17% CESS.
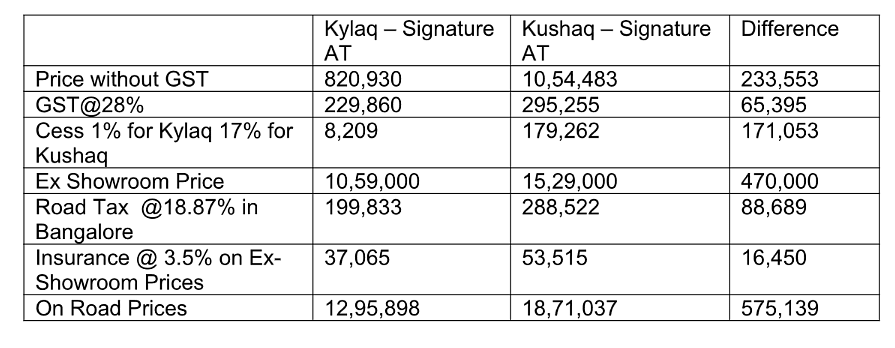
The knife takes an even more painful turn when state road taxes in the region of around 15-20% are applied and done so on the price of the car, which includes the GST and CESS applied earlier. An example for all to see is the Skoda Kylaq which is a 4-meter-long car having the same features and a 1.0-liter petrol turbo engine with a 6 speed Aisin automatic that the Skoda Kushaq has.
The difference at the showroom price is 4.7 lakhs for the Signature edition and with state road taxes in Bangalore, this difference is a whopping 5.75 lakhs. Though there are differences in features at the comfort level, a simple weighted average price positioning exercise would not peg these at more than a lakh or less in value terms for the customer, making the Kushaq a good 4.75 lakhs more expensive in value terms to the Kylaq.
The table below explains how the taxation works for the 2 cars.
Now, let us look at the critical differences between the Kylaq and the Kushaq in terms of features.
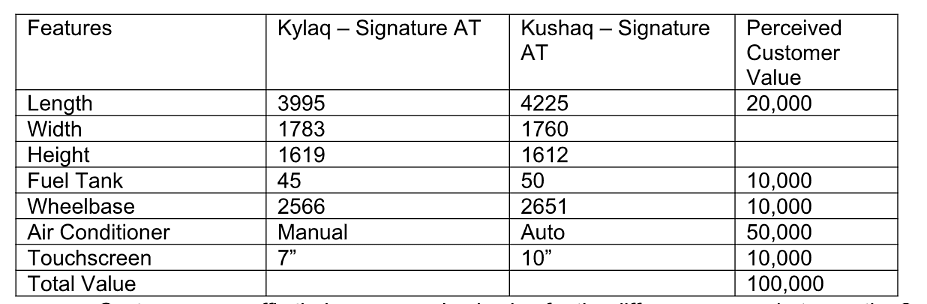
- Customers can affix their own perceived value for the differences seen between the two cars. There are no hard and fast rules, and this value is NOT based on costs to manufacturer but what the customer perceives as value.
- The two cars share exactly the same 1.0-liter TSI engine and 6 speed Aisin Torque Convertor gear box.
- Similar exercises can be conducted in far greater detail on many more such models such as the Maruti Grand Vitara and the Maruti Vitara Brezza both of which share the same engines and gearboxes or the diesel versions of the Kia Sonet and the Kia Seltos, both of which again share the same diesel engines and automatic gearboxes.
Further down we have SUVs that are around 200 to 300 mm shorter than 4 m, and this is where the mini-SUV segment comes in the segment is exemplified by the Tata Punch. Its huge growth attracted Hyundai to come out with Exter.
Similarly, we have micro-SUVs, where you see hatchbacks on stilts being positioned as SUVs by salespersons at dealerships. The S-Presso and Kwid could be classified here.
The other brilliant sub segments of the SUV segment are the large SUV segment where you see the likes of Mahindra XUV 700 the Mahindra Scorpio-N the Tata Harrier and the Tata Safari
There are various other segments in the SUV segment such as the large and premium SUV segment that is typified by the likes of the Toyota Fortuner. The power ratings and prices are in a different league altogether when compared to the large SUV segment.
Similarly, we can break up the sedans, the hatchbacks and the MUV segments into various sub segments whose details you see in the charts and tables below.
One of the most powerful ways of understanding where the growth numbers lie is not just looking at the sales numbers, but by looking at the growth in those sales numbers at a compounded annual growth rate or CAGR calculated at both one year as well as three years. This helps readers to understand whether a sub segment is showing a combination of long-term as well as short-term growth.
This is where OEM’s and their planners understand where exactly the meat of the market lies and so also the bones!
Similar studies can also be conducted on understanding where exactly the feature sets that customers are looking for are growing. But for this study to be conducted, a perfectly accurate estimate of the number of sales of each of the trim levels in different models needs to be available. Given that these numbers are not freely available we are using wholesale numbers, which is the number of models of each of the cars that manufacturers are dispatching to dealers on a monthly basis.
The assumption here is that over a period of time these numbers match up with retail numbers, which is the actual numbers that are sold by dealerships each month. There is a lag of a month or two between these numbers and my understanding is that this difference should not hurt the directional understanding that we are working on in order to throw more light on which segments of the market are growing and merit investment and which segments of the market are shrinking and need to be avoided.
See this graph for more details.
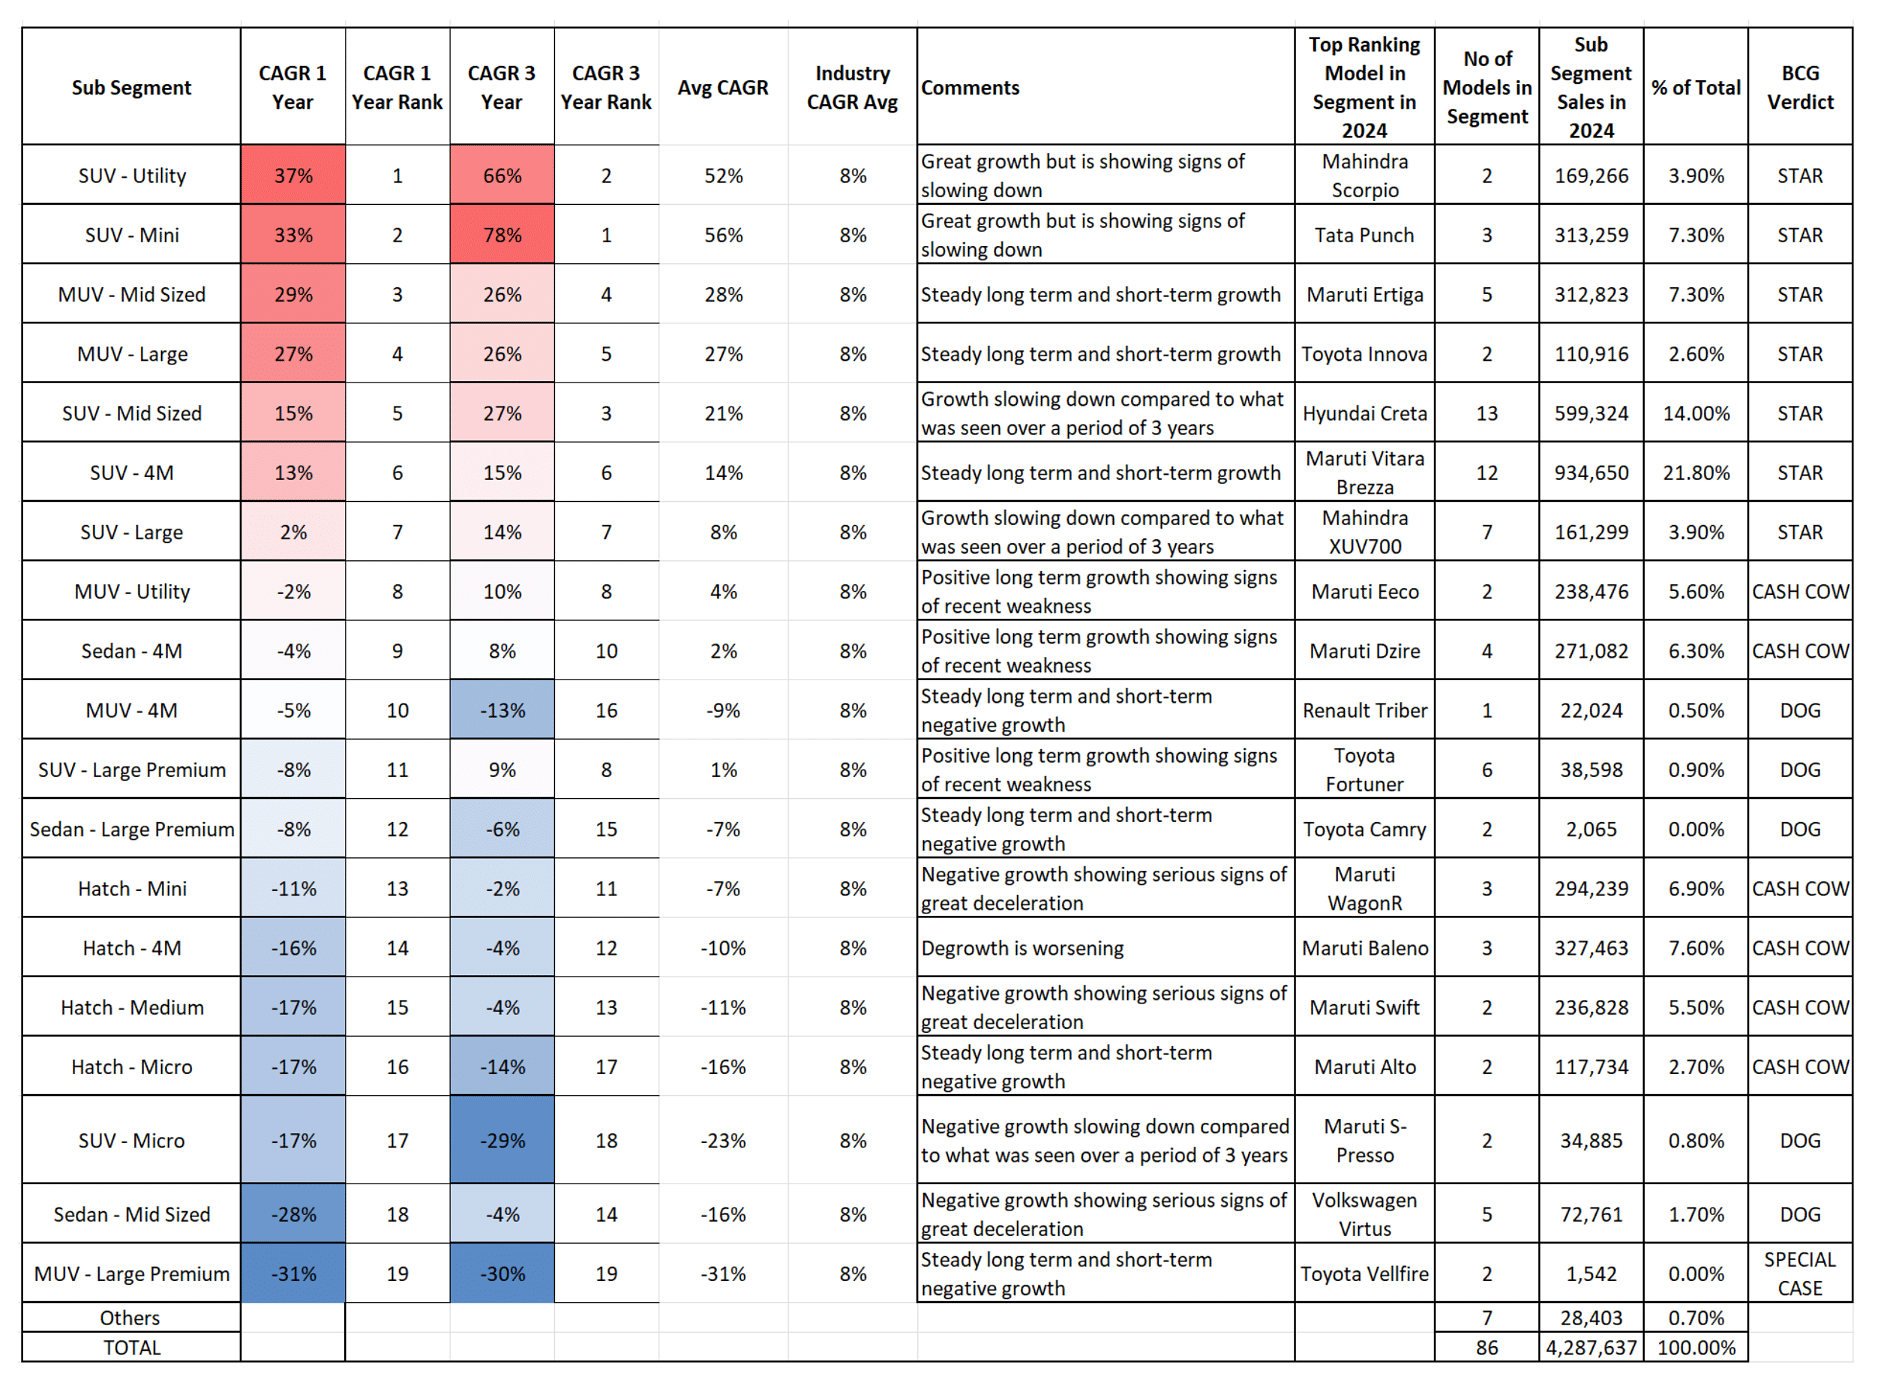
With an Industry growth CAGR of 4.6% last year and around 11.7% (averaging 8%) for the last 3 years we can categorize segments that are growing higher with huge volumes
This graph explains the contribution of each of the sub segments to the overall growth of the car market in 2024.
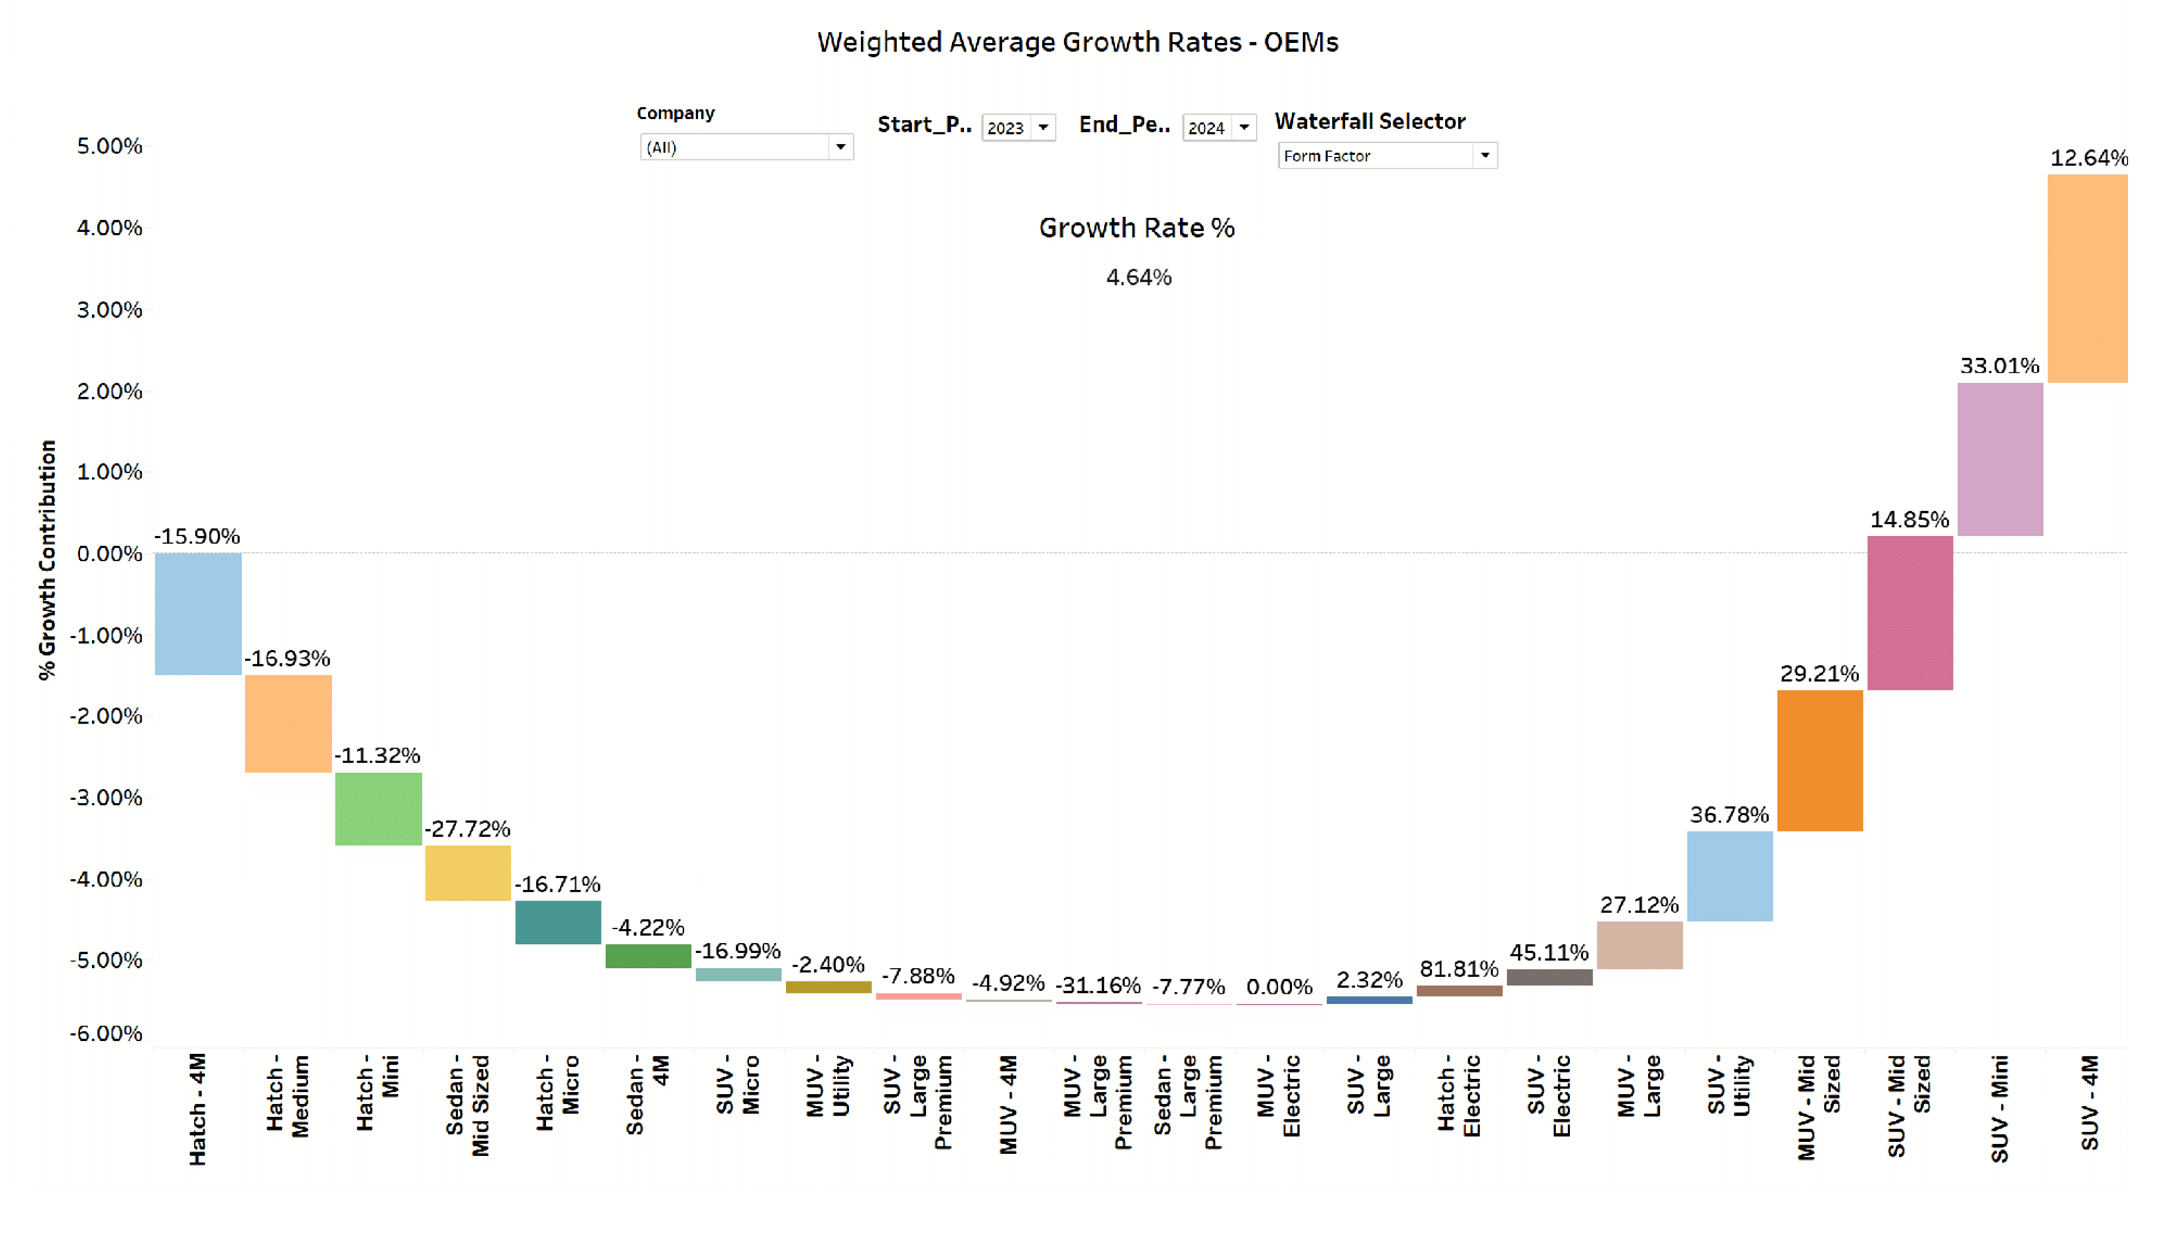
So though in terms of individual sub segment ranking in table 1, the SUV Utility topped the class, as a weighted average based on the weight of the sub segment in the overall car market, it stands 5 th as can be seen above and similarly the SUV 4M contributed the highest to the growth last year though individually at 13% growth it ranked 6 th amongst all sub segments.
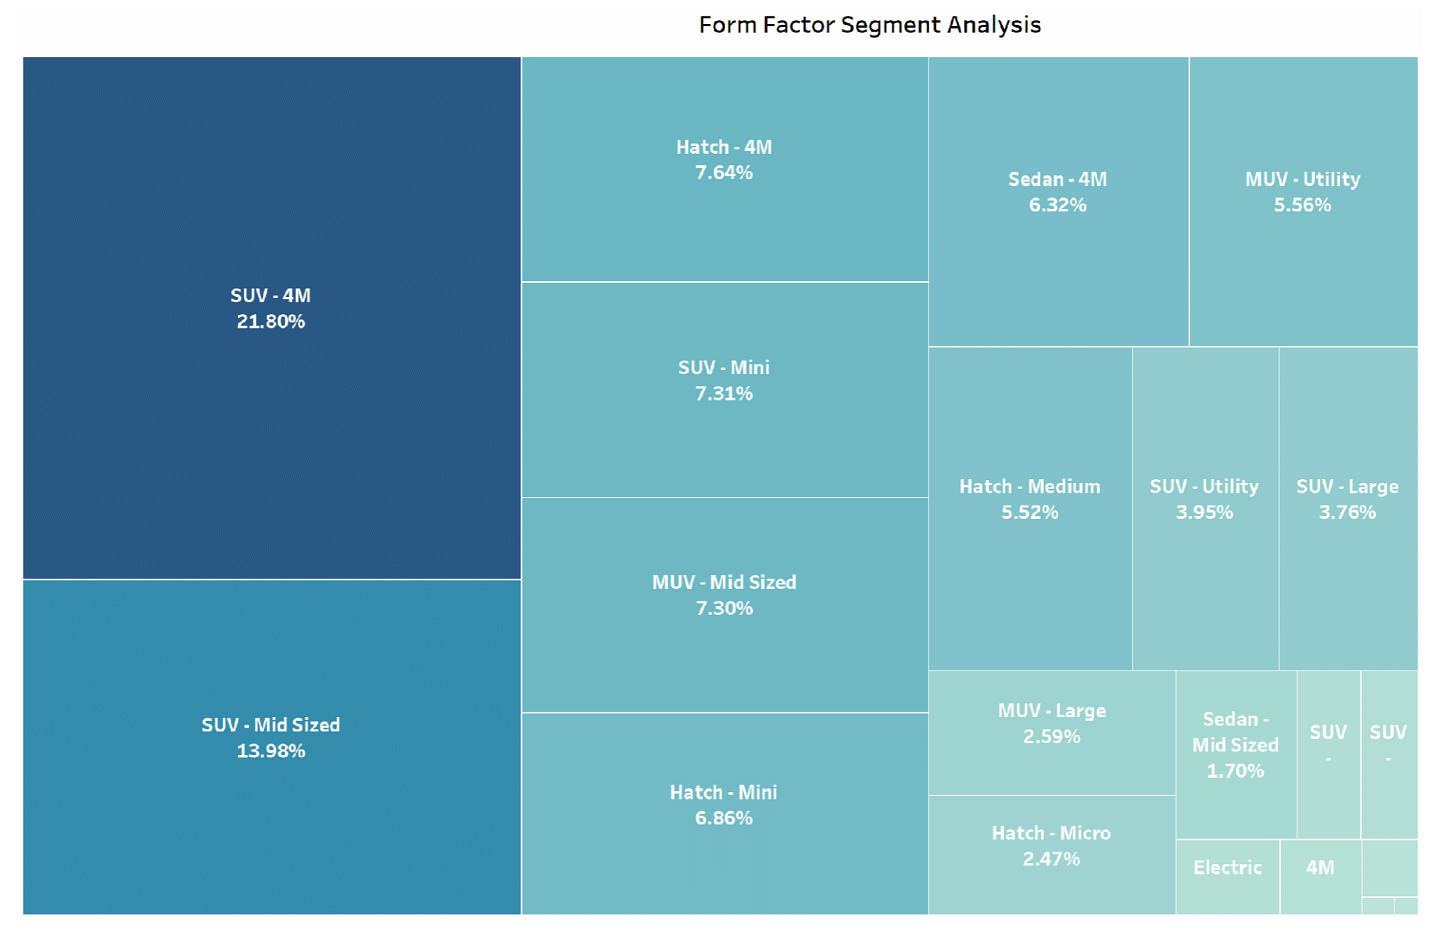
This table tells us about the contribution of each sub segment to the overall market in 2024:
 How do the various sub segments look when analyzed from a perspective of individual growth and volumes with respect to the market growth?
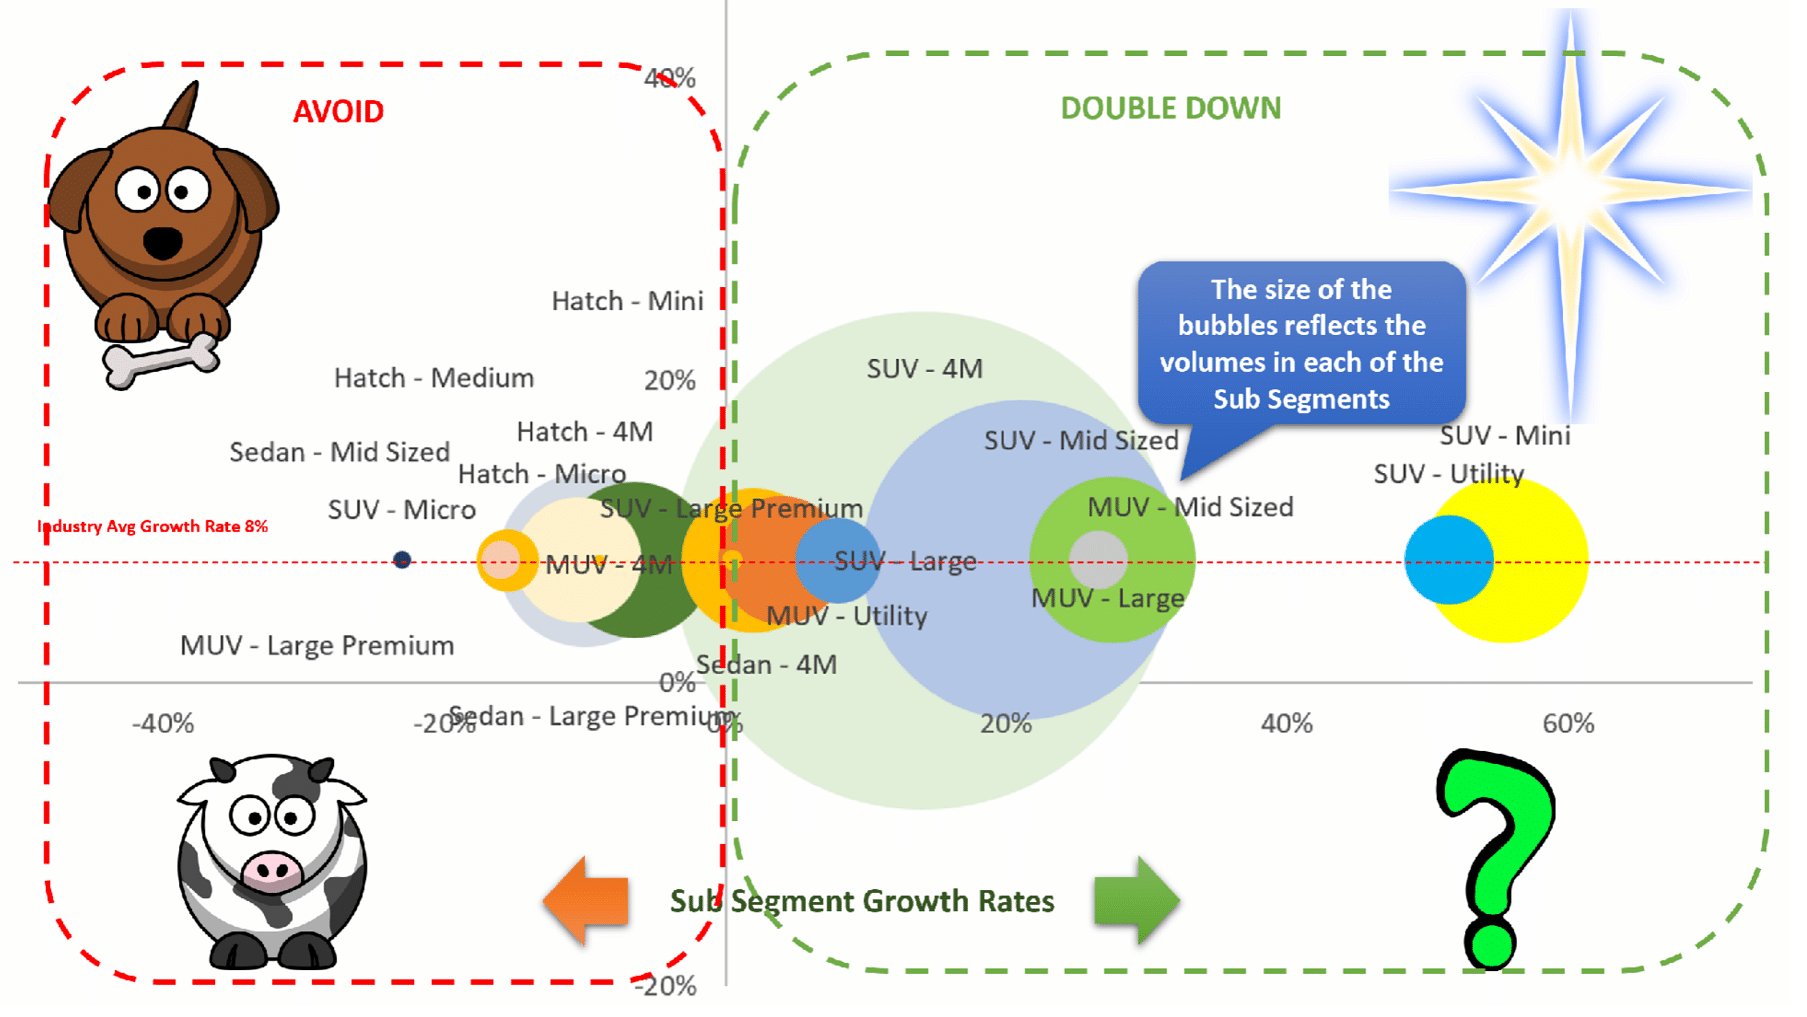
The above is similar to what we see in the Boston Consultancy Group or BCG matrix where we plot individual products at their growth rates on the X axis with the segmental growth shown on the Y axis. Here since we are looking at each of the sub segments as a product trying to understand where it stands in the overall industry scenario, we see that all the sub segments to the right can be looked at as the shining stars if the bubble size is huge and a question mark if the bubble size is small. These are all worthy of further investments.
Similarly, when we look at the left side of the graph we see segments such where the bubble sizes are huge but are having low or negative sub segment growth rates which can be seen as cash cows and those with low volumes and low growth rates as dogs which need to be divested. There are certain exceptional cases such as the MUV large Premium that has players like the Toyota Vellfire and the Kia Carnival which are sold as CBUs and the segment showed negative growth because Kia withdrew the Carnival from the market for over a year and then re-introduced the same recently.
If the entire industry was to take a call on which segments to get into and which to avoid, a good study of Exhibits 1 and 4 would do the job for them. The graph below shows how the various OEMs are placed in this scheme of things. The meat of the matter lies in some of the segments that have been marked out above as Stars. These are the segments that will see huge growth and volumes in the times to come. Nothing is permanent and we have seen the heyday of the hatchbacks and the sedans. But a close look at the momentum of growth being displayed will give key actors in this industry an exceptionally good understanding of where different segments are going well in advance of their rise or demise.
The last graphic clearly shows which are the OEMs that are in the red zone and which are in the green zone. The percentages tell us how their product portfolios were distributed across the various sub segments in 2024. Renault (74%) Honda (60%) Volkswagen (53%) and Maruti (58%) have a major part of their product portfolio in those sub segments that are not showing either long term or short term growth prospects. It’s the time to reflect!

(Niranjan N Prabhu is Head of Analytics and Data Insights Specialist at Cargraphical Analytics Solutions. Views expressed are the author's own.) This article is also available as a PDF
RELATED ARTICLES

No.4 Twice in a Row: What's Behind Hyundai Motor India's Underperformance
![]() Sreejith Rajan
07 Apr 2025
Sreejith Rajan
07 Apr 2025
What are the factors that has led the Korean car brand, which has had a steady grip over the No.2 slot in India's car ma...

India’s Auto Electrification Slows as Government Support Dries up
 Shruti Shiraguppi
07 Apr 2025
Shruti Shiraguppi
07 Apr 2025
Surprisingly, the penetration of EVs in total sales fell to 9.9% in Mar’25 from 10.3% in Mar’24, at a time when the mark...

Eight Charts That Capture India's Car Market in 2024
 Autocar Professional Bureau
13 Jan 2025
Autocar Professional Bureau
13 Jan 2025
A visual journey through the highs and lows of the fast-growing Indian car market in 2024.